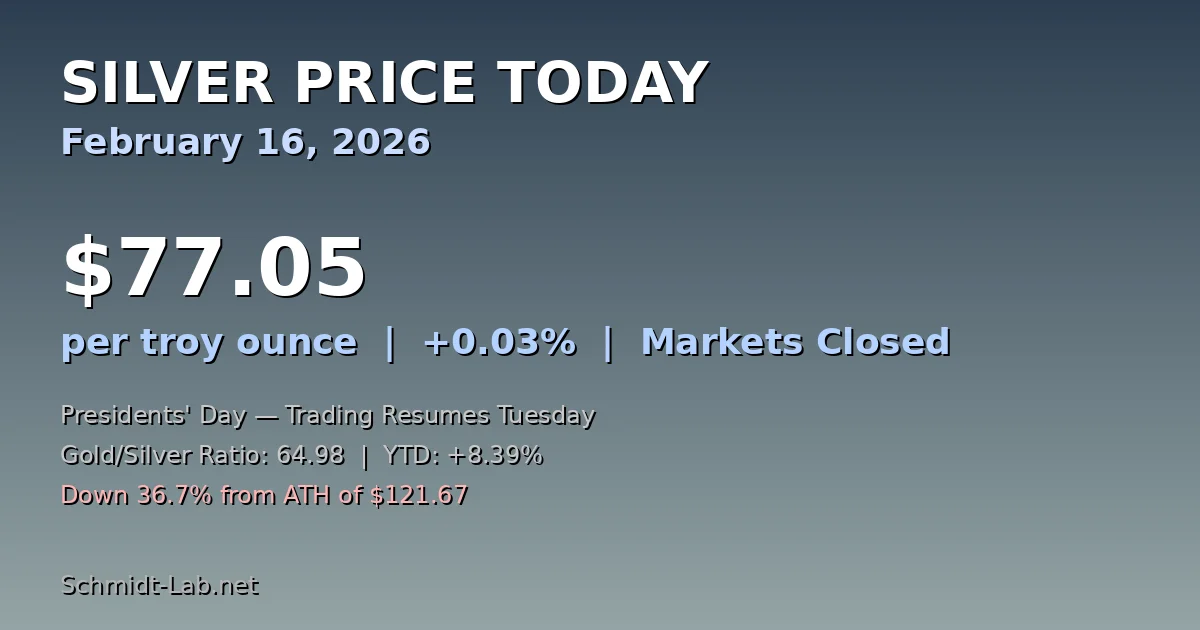
After climbing from $30/oz in January 2025 to an all-time high of $121.67 in January 2026, silver has consolidated around $80/oz in mid-February. The question now is whether this represents the start of a new era for precious metals pricing, or a correction within a broader consolidation range.
The answer depends on three fundamental questions: Will the supply deficit persist? Can industrial demand continue accelerating? And will macroeconomic conditions support higher prices? Here's the outlook.
Current Market State: January 2026 Snapshot
Silver entered 2026 at approximately $30/oz, reflecting a year of building momentum. The January 29 all-time high of $121.67 represented a 304% gain in twelve months—the largest single-year rally since 1980. Yet despite reaching ATH, silver quickly consolidated to the $75-$85 range, suggesting profit-taking and uncertainty about sustainability.
This pattern is normal: Large moves attract speculative capital, which rushes for exits when sentiment shifts. The question is whether the underlying supply-demand dynamics justify the higher level, or whether prices overshot fundamentals.
- Current Price Context:
- Down ~34% from ATH ($121.67 → $80)
- Still up 167% from January 2025 start ($30)
- Trading above 2011 previous peak of $48.75
- Above historical average cost of mine production (~$13-15/oz)
The consolidation around $80 is healthy. It represents institutional investors and end-users determining what price they'll accept for silver, and what supply they can secure at that level. If prices stabilize here, supply and demand have found equilibrium—at least temporarily.
Supply Dynamics: The Structural Deficit
Industrial silver supply hasn't kept pace with demand for six consecutive years. Here's why this matters:
- Global Mine Production (2024 estimates):
- Total primary and secondary supply: ~850-900 million ounces
- Mine production: ~700-750 million oz (primary)
- Recycled silver: ~150-200 million oz (secondary)
- Capacity growth rate: 1-2% annually (constrained by copper, zinc byproduct mining)
- The Byproduct Problem:
- 71% of silver comes as a byproduct of copper, zinc, and lead mining. Miners can't increase silver production without increasing base metal production. Copper mining has its own constraints:
- Long development timelines (8-12 years from discovery to production)
- Environmental permitting delays
- Geopolitical tensions (Peru, Chile producing 40%+ of global supply)
- Energy costs rising due to renewable transition requirements
Result: Silver production growth is largely decoupled from silver prices. Even if silver doubles in value, miners can't significantly increase output.
- Cumulative Deficit:
- 2019-2024: Persistent annual deficits averaging 40-50 million oz
- Cumulative shortfall: ~820 million ounces (largest in 70 years)
- Above-ground stockpiles: Declining, estimated at 2-3 billion oz remaining
- Draw rate at current levels: Could exhaust reserves in 400-500 years (comforting, but only if demand stays flat)
If industrial demand grows 5-10% annually while supply grows 1-2%, the deficit widens. Higher prices eventually ration demand or trigger recycling, but the transition period creates upside pressure.
Industrial Demand Acceleration: The Real Driver
Three demand streams are accelerating in 2026:
Solar Energy Manufacturing
Current Volume: 185-240 million ounces annually (2024-2025 estimates)
Growth Rate: 15-20% compound annual growth
- Why It Matters:
- Silver is essential for photovoltaic cell conductivity
- Modern panels require 10-15 grams per watt of capacity
- Global installed solar capacity growing from 1,500 GW (2024) to 3,000+ GW by 2030
- Climate targets require solar tripling in the next 10 years
- 2026 Outlook:
- Installed capacity additions: 350-400 GW annually
- At 10-12g per watt, this requires 35-48 million oz annually
- Total solar demand: 210-280 million oz in 2026
- Growth rate: +10-15% from 2025
If solar beats expectations (Germany installing more than forecast, India accelerating, China maintaining momentum), demand could spike to 300+ million oz. This represents ~35% of global mine production—a structural floor for prices.
Electric Vehicle Manufacturing
Current Volume: 90+ million ounces annually
Growth Rate: 30-40% compound annual growth
- Why It Matters:
- Each EV contains 45-50 grams of silver for:
- - Conductive paste in power electronics
- - Thermal management coatings
- - Connectors and relay switches
- - Emerging use in solid-state battery components
- Global EV sales: 14 million units (2024); projected 35-40 million by 2030
- 2026 Outlook:
- EV sales: 18-22 million units
- At 45-50g per vehicle: 810-1,100 million oz demand
- Total EV silver demand: 100-120 million oz in 2026
- Growth rate: +20-25% from 2025
The wildcard: Solid-state batteries under development could require 2-3x more silver per vehicle, potentially doubling EV-related demand. This is speculative but in advanced stages at multiple OEMs (Toyota, Samsung, QuantumScape).
Emerging: AI and Data Centers
Current Volume: 5-10 million oz annually (estimate; limited disclosure)
Growth Rate: 40-50% compound annual growth
- Why It Matters:
- AI model training requires GPU-intensive data centers
- Silver used in:
- - Thermal paste for heat dissipation (GPUs generate 300-500W per processor)
- - Conductive coatings for circuit boards
- - Server connector pins and thermal interfaces
- Hyperscaler capex: $100+ billion annually, majority going to compute infrastructure
- 2026 Outlook:
- Data center buildout accelerating due to GenAI adoption
- Difficult to quantify, but emerging evidence suggests 10-20 million oz demand
- Growth rate: +30-40% as more models deployed
- Upside if AGI timelines accelerate
Total Industrial Demand Summary:
| Sector | 2025 Volume (M oz) | 2026 Forecast (M oz) | Growth Rate | Upside Risk |
|---|---|---|---|---|
| Solar | 210 | 240 | +14% | +40 (if capacity beat expectations) |
| Electric Vehicles | 90 | 110 | +22% | +50 (if solid-state batteries accelerate) |
| AI/Data Centers | 10 | 18 | +80% | +20 (if GPU deployment exceeds forecast) |
| Traditional Industrial | 280 | 285 | +2% | +/- 10 (mature demand) |
| Jewelry & Coins | 180 | 195 | +8% | +/- 20 (discretionary) |
| Total | 770 | 848 | +10% | +150 |
Global mine supply is 700-750 million oz. If demand reaches 848-850 million oz, the deficit widens from 50-100 million oz to 100-150 million oz. This compresses above-ground stockpiles and forces prices higher.
Macroeconomic Tailwinds: Fed Policy and Inflation
Interest Rate Expectations
- The Federal Reserve enters 2026 with rates at 4.25-4.50%, having paused hikes in mid-2023. Market pricing implies:
- 2-3 rate cuts in 2026 (25-75 basis points total)
- Trigger: Inflation moderating to 2-2.5%, growth remaining stable
- Baseline case: First cut in Q2 2026 if CPI remains subdued
Silver Implications: Lower rates reduce opportunity cost of holding non-yielding precious metals. Every 25 basis point cut makes cash returns less attractive relative to silver as a store of value. Three cuts totaling 75 basis points could unlock significant demand.
Inflation Dynamics
- Current inflation metrics (December 2025 data):
- PCE inflation: 2.4% (near Fed target)
- Core PCE: 2.8% (moderating)
- Producer prices: Stable
- Wage growth: 3.5-4.0% (moderate)
Silver Implications: If inflation stays contained, real interest rates remain slightly positive, limiting silver's appeal as an inflation hedge. However, if goods inflation resurges (energy disruption, supply chain shock), real rates turn negative and silver becomes compelling hedge.
Current consensus: Inflation stays around 2.3-2.8%, but tail risks exist (geopolitical energy shock, supply chain disruption from climate events).
Dollar Strength
- The U.S. dollar index trades around 103-105 in early 2026. Inverse relationship with silver:
- Weak dollar (below 100): Benefits silver as imports become expensive, creating inflation pressure
- Strong dollar (above 105): Pressures silver as non-USD buyers face headwinds
2026 Outlook: Likely dollar range: 100-107. This is neutral-to-slightly-weak, supporting silver modestly. If Fed cuts aggressively, dollar likely weakens to 95-100, creating tailwind for silver.
Investment Demand and Central Bank Accumulation
- ETF Inflows:
- SLV (iShares Silver Trust): ~$15-20 billion inflows in 2025
- PSLV (Sprott Physical Silver): Strong inflows; premium to spot widening
- Global silver ETFs: Estimated $50+ billion total assets
If 2026 sees similar inflows, that's 50+ million oz demand above industrial needs, adding ~6-7% to total demand.
- Central Bank Activity:
- China: Steadily accumulating (not disclosed, but import data suggests 20-30M oz annually)
- Russia: Purchases after sanctions as part of de-dollarization
- India: Modest accumulation for strategic reserves
- Total central bank demand: 30-50 million oz annually (estimate)
Central bank buying creates a floor under prices. Unlike speculators, central banks don't sell in downturns.
Scenarios for Silver in 2026
Base Case (60% probability): Gradual Recovery to $85-$100
- Supply deficit confirmed and persistent
- Industrial demand grows 8-12% as expected
- Fed cuts 2-3 times; inflation stays ~2.5%
- Dollar weakens modestly to 100-105 range
- Investment flows remain positive but not explosive
Price Action: $75-$95 trading range through 2026, with attempts at $100-$105 failing initially, then breaking through in Q4 2026.
Bull Case (25% probability): Supply Shock Drives $120+
- Solar deployment exceeds 400 GW installations (beats forecast)
- EV sales momentum accelerates (25M+ units instead of 20M)
- Above-ground inventory surprise (low available supply data emerges)
- Fed forced to cut aggressively (4-5 cuts if growth weakens)
- Central bank buying accelerates due to de-dollarization
Price Action: Breakout above $110 in Q2-Q3 2026, test of $121 ATH, potential new highs $130-$150 if momentum builds.
Bear Case (15% probability): Demand Deteriorates to $55-$65
- Recession signals force industrial buyers to defer purchases
- Solar and EV deployment slows due to financing constraints
- Fed holds rates or cuts only one time (hawkish pivot)
- Dollar strengthens on safe-haven demand
- Above-ground inventory released; speculative positioning unwinds
Price Action: Break below $70 support in H2 2026, accelerating decline to $55-$60 as momentum sells unwind.
The Path Forward: What to Watch
- Bullish Signals:
- USGS data showing solar/EV demand exceeding forecasts
- Silver Institute reporting deficit wider than 50M oz annually
- Fed cutting rates on schedule (first cut by June 2026)
- ETF flows remaining positive above $200M weekly average
- CFTC Commitment of Traders showing commercial accumulation (non-spec buying)
- Bearish Signals:
- Recession indicators triggering (unemployment rising, ISM PMI below 50)
- Dollar index approaching 110 (strong dollar environment)
- Yields on 2-year Treasuries rising above 2.5% (real rates positive)
- Mining production data showing surprising growth
- Above-ground inventory data suggesting plentiful supply
Conclusion: The Direction Is Up, But Timing Is Uncertain
- Silver's 2026 trajectory depends on whether the supply deficit and industrial demand growth prove durable. The evidence is compelling:
- 6 years of documented deficits
- Solar and EV demand accelerating exponentially
- Central banks supporting prices with purchases
- Fed likely to accommodate with lower rates
However, execution risk exists. If any of these tailwinds fail to materialize, prices could consolidate or retest support. The consolidation from $121.67 to $80 is healthy and normal. It's not a rejection of higher prices; it's price discovery.
For the most comprehensive analysis of silver's fundamentals, see our complete silver price and value guide and the supply deficit deep dive.
The base case points to higher prices through 2026, with $85-$100 the most likely range and $120+ achievable if execution beats expectations. Your advantage comes from understanding which factors are priced in (supply deficit likely is) and which are underappreciated (data center demand emerging). The market will determine silver's direction, but the structural tailwinds suggest that down moves are buying opportunities, not warnings.You May Also Like
- Silver Price in 2026: Current Value, Where It Is Headed, and How to Invest - Related article
- Silver Supply Deficit 2026: Why Industrial Demand Is Outpacing Mine Production - Related article
- How High Will Silver Go in 2026? Price Ceiling Analysis and Forecasts - Related article
- How to Buy Silver - Step-by-step guide to purchasing silver
- Best Silver Dimes Value Guide 2026: Mercury, Roosevelt, and Barber Dime Prices for Investment - Specific silver coins to consider investing in
Sources
Written by
Sarah Kim
Collectibles market analyst covering precious metals, coins, and alternative investments.