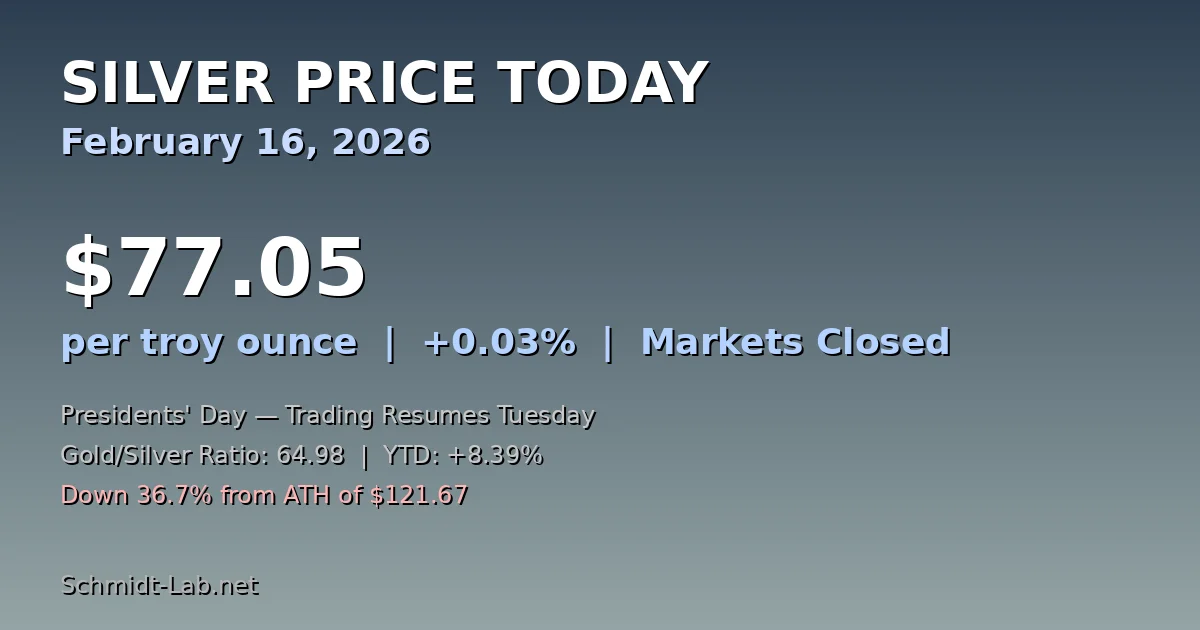
Silver opens the week at $77.05 per troy ounce on Monday, February 16, 2026 — essentially flat from Friday's close of $77.03 as U.S. markets observe the Presidents' Day holiday. With the NYSE, Nasdaq, and COMEX all shuttered today, trading volume is razor-thin, and the real action won't resume until Tuesday morning.
Live Silver Spot
USD per troy ounce • source: RapidAPI (real-time-metal-prices)
Updated just now. Refreshes every 60 seconds.
But don't let the quiet holiday fool you. Silver is sitting at a critical inflection point after one of the most violent months in precious metals history.
Silver Price Snapshot — February 16, 2026
| Metric | Value |
|---|---|
| Spot Price | $77.05/oz |
| Bid | $75.09 |
| Ask | $78.09 |
| Daily Change | +$0.02 (+0.03%) |
| Per Gram | $2.48 |
| Per Kilogram | $2,477 |
| Gold/Silver Ratio | 64.98 |
| YTD Performance | +8.39% |
| All-Time High | $121.67 (Jan 29, 2026) |
| Down From ATH | -36.7% |
What Happened This Week
Silver spent the week consolidating in the $77–$83 range, unable to break decisively in either direction. Here's what drove the price action:
Monday–Wednesday: Silver climbed nearly 2% above $82 as disappointing U.S. economic data and deteriorating consumer confidence boosted safe-haven demand. The Dollar Index (DXY) struggled for direction, giving silver room to rally.
Thursday: Profit-taking kicked in hard. Traders who bought the dip from the January crash locked in gains, pushing silver back below $80. The mid-week reversal underscored just how fragile sentiment remains.
Friday (Feb 14): Silver closed at $78.06 on the final trading day before the long weekend, settling into what appears to be a near-term equilibrium zone. The gold/silver ratio tightened from 65.33 to 64.98, a modest positive signal for silver bulls.
The January Crash: A Quick Recap
If you're wondering why silver is at $77 when it was above $120 just three weeks ago, here's the short version:
On January 29, 2026, silver hit a nominal all-time high of $121.67 per ounce. The very next day, it lost over 35% in a single session — the largest daily percentage drop in silver's history. Within three days, silver had fallen 41%.
Three forces collided to create the perfect storm. The CME Group hiked margin requirements on silver futures from 11% to 15%, forcing leveraged speculators to either inject massive capital or liquidate immediately. Simultaneously, Trump's nomination of Kevin Warsh as Fed Chair was seen as hawkish, strengthening the dollar and pressuring commodities across the board. U.S. Treasury Secretary Scott Bessent later described the action as a "classical speculative blowoff" driven largely by Chinese traders unwinding massive positions.
Gold suffered too — dropping over 12% on January 30, its largest single-day fall since the 1980s — but silver, as always, amplified the move.
Where Silver Stands Now: Key Levels to Watch
After the crash, silver has carved out a trading range between roughly $75 and $83. Here's what technically matters:
Support levels: $75.00 (psychological + recent bid floor), $70.00 (Bank of America's estimated fair value zone), $60.00 (worst-case if another margin-driven selloff hits)
Resistance levels: $82.00 (this week's intraweek high), $85.00 (UBS's year-end target), $100.00 (UBS's March target, psychological milestone)
The gold/silver ratio at 64.98 is near the lower end of its multi-year range, which historically signals that silver is relatively strong compared to gold. When this ratio drops below 60, silver has typically been overextended — so there may still be room for silver to outperform from here.
What the Analysts Are Saying
The crash has split Wall Street into camps:
- The Bulls:
- UBS forecasts silver returning to $100 by March, then settling back to $85 by year-end
- J.P. Morgan projects silver averaging $81/oz for all of 2026 — more than double its 2025 average
- GoldSilver's Alan Hibbard is the most aggressive, projecting $175+ per ounce and calling for silver to outperform its 147% gain from 2025
- The Bears (or at least the cautious):
- Bank of America estimates fair value at $60–70/oz, suggesting the current price may still be elevated
- Goldman Sachs warned about the "persistent London liquidity squeeze" adding extreme price behavior
- UBS also cautioned that "an asset exhibiting 60–120% volatility requires an expected return of 30–60% to go long"
Fundamental Case: Why Silver's Floor May Be Higher Than You Think
Despite the crash, the structural case for silver remains intact:
Supply deficit persists. According to the Silver Institute, 2026 marks the sixth consecutive year of annual market deficit. Mine supply simply cannot keep pace with demand.
Industrial demand is accelerating. Solar panel manufacturing, electric vehicles, and AI data center infrastructure all require silver. This isn't speculative — it's physical demand that doesn't disappear when paper markets crash.
Central banks keep buying. Gold purchases by central banks have become structural rather than sporadic, and this rising tide lifts all precious metals.
Rate cuts are coming. The Federal Reserve is widely expected to hold rates steady in March but deliver two rate cuts later in 2026. Lower rates historically support precious metals prices.
What to Watch When Markets Reopen Tuesday
Several catalysts could move silver sharply when trading resumes:
Delayed U.S. economic data: The jobs and inflation reports originally scheduled for this past week will be released in the coming days. Strong data = stronger dollar = pressure on silver. Weak data = rate cut expectations rise = silver rally.
Gold's $5,000 battle: Gold briefly pushed above $5,000 on February 13 before pulling back. If gold can hold above that psychological level, it creates a rising tide for silver.
Physical demand signals: Watch for reports from the London Bullion Market Association (LBMA) and COMEX vault data. The persistent London liquidity squeeze that Goldman flagged could resurface at any time.
Should You Buy Silver at $77?
This is the question everyone's asking. Silver is 37% below its all-time high but still up 8.4% year-to-date and roughly 150% above where it traded a year ago.
The honest answer: it depends on your time horizon and risk tolerance. If you're a long-term holder who believes in the supply deficit thesis and industrial demand story, buying on a 37% pullback from all-time highs could look smart in hindsight. If you're a short-term trader, the 60–120% annualized volatility means you could easily see another 20% move in either direction within weeks.
For those looking to add silver to their portfolio, consider our guides on how to buy silver and the best silver coins to buy in 2026. If you're trying to decide between physical metal and paper, our silver bars vs. coins comparison breaks down the pros and cons.
And if you're holding silver and wondering whether to sell into this bounce, check our how to sell silver guide and the silver tax guide so you understand the capital gains implications.
The Bottom Line
Silver at $77 on Presidents' Day is a market catching its breath. The January crash shook out the weak hands and leveraged speculators, but the fundamental story — supply deficits, industrial demand, central bank buying, and coming rate cuts — hasn't changed.
The question isn't whether silver will be volatile in 2026. It will be. The question is whether $77 looks more like a floor or a ceiling when we look back at the end of the year. Most analysts lean toward the former, but as the January crash reminded us all, markets can humble even the strongest convictions overnight.
We'll be back with a full market update when trading resumes Tuesday. Stay sharp.
You May Also Like
- Where Is Silver Headed in 2026? Price Forecast & Analysis — Our comprehensive outlook for the year ahead
- Is Silver a Good Investment in 2026? — Weighing the bull and bear case at current prices
- Gold vs. Silver Investment: Which Precious Metal Should You Buy? — How to decide between the two metals
- Silver Industrial Demand: How Solar & AI Are Driving Prices — The demand story behind the deficit
- Gold-to-Silver Ratio in 2026: What It Means for Investors — Understanding the ratio at 64.98
Sources
Written by
Sarah Kim
Collectibles market analyst covering precious metals, coins, and alternative investments.