Gold shattered records throughout 2025, climbing 44% to an annual average of $3,431 per ounce before pushing past $5,000 in early 2026. Central bank buying topped 1,000 tonnes for the third consecutive year, and Wall Street's biggest banks are calling for $5,000 to $6,300 by year-end. Below is the live spot price updated every 60 seconds, followed by 2026 forecasts and the smartest ways to invest.
Current Gold Spot Price Per Ounce, Gram, and Kilo
| Period | Gold Price Per Ounce |
|---|---|
| January 2024 | ~$2,050 |
| October 2024 | ~$2,750 (then-record) |
| April 2025 | ~$3,500 |
| Q4 2025 average | $4,135 (record quarterly average) |
| January 2026 | ~$5,000+ (new all-time high) |
| Current | See live table above |
Gold has gained roughly 140% since January 2024. The rally is unlike anything the market has seen in decades. It is driven not by retail speculation but by central banks systematically converting dollar reserves into physical gold. Total annual gold demand hit a record 4,974 tonnes ($382 billion) in 2025, with central bank and institutional buying accounting for nearly a quarter of all demand.
Gold Price Forecast 2026: JPMorgan, Goldman Sachs, and Bank of America Predictions
Wall Street is unanimously bullish on gold for 2026, though price targets span a wide range depending on how aggressively central banks continue buying.
| Institution | 2026 Gold Price Forecast | Key Reasoning |
|---|---|---|
| JPMorgan | $6,300 by year-end | Central bank buying at 800 tonnes, structural diversification from dollar |
| Goldman Sachs | $5,400 by year-end | Central banks at 80 tonnes monthly, ETF inflows accelerating |
| Bank of America | $5,000 average; $6,000 possible | Fiscal instability, safe-haven demand, loss of faith in traditional assets |
| UBS | $5,000 base case | Fed rate cuts boosting non-yielding asset appeal |
The consensus: gold's structural drivers are intact and strengthening. JPMorgan has modeled an extreme scenario where gold reaches $8,000 to $8,500 per ounce if private investors raise their gold allocation from roughly 3% to 4.6% while central bank buying remains elevated. Goldman Sachs notes that the gold ETF market is roughly 70 times smaller than the U.S. Treasury market, meaning even modest diversification out of bonds could drive significant upside.
Why Is Gold Surging? The Central Bank Buying Revolution
The single biggest driver of gold prices since 2022 is central bank purchasing at a scale not seen in modern history. In 2022, central banks bought a record 1,082 tonnes. They followed with 1,037 tonnes in 2023, over 1,000 tonnes again in 2024, and 863 tonnes in 2025.
What triggered this? On February 26, 2022, Western nations froze roughly $300 billion of Russia's foreign reserves held in dollars and euros. Goldman Sachs called this a "big wake-up call" for every central bank on the planet. If your reserves can be frozen by political decisions, they are not truly yours.
The response was immediate and structural. Countries began converting dollar-denominated assets into physical gold, which cannot be frozen, sanctioned, or seized by any foreign government.
Top Central Bank Gold Buyers in 2025:
| Central Bank | 2025 Purchases (tonnes) | Total Reserves (tonnes) |
|---|---|---|
| National Bank of Poland | 95 | ~480 |
| National Bank of Kazakhstan | 49 | ~410 |
| Central Bank of Brazil | 43 (last 3 months alone) | 172 |
| People's Bank of China | Undisclosed (estimated 200+) | ~2,300 (official) |
| Reserve Bank of India | ~45 | ~880 |
Twenty-two central banks reported gold reserve increases of one tonne or more in 2025 alone. The World Gold Council's annual survey showed the strongest intention to continue buying since the survey began in 2019. This is not a trade. It is a multi-year, structural portfolio rebalancing away from the dollar.
The Gold-to-Silver Ratio in 2026
One way investors gauge relative value between precious metals is the gold-to-silver ratio. This tells you how many ounces of silver it takes to buy one ounce of gold.
In April 2025, the ratio was above 100:1, meaning silver was historically cheap relative to gold. By early 2026, it had fallen to around 50:1 as silver surged, before rebounding to roughly 74:1 in mid-February. The historical average is 60:1 to 70:1.
When the ratio is high (above 80), many investors swap gold for silver expecting silver to catch up. When it drops below 50, they rotate back into gold. The current ratio of ~74 suggests relative equilibrium, with a slight tilt toward silver being the better value play.
How to Invest in Gold in 2026
There are several ways to get exposure to gold, each with different trade-offs in cost, liquidity, and tax treatment.
Physical bullion (bars and coins). You own the actual metal. Gold is denser and more valuable per ounce than silver, making storage more practical. A single 1 oz American Gold Eagle currently trades above $5,000. The downsides are dealer premiums (typically 3-8% above spot for coins), storage costs, and insurance. When you sell, you are subject to the collectibles capital gains tax rate.
Gold ETFs. The three most popular options are SPDR Gold Shares (GLD) with a 0.40% expense ratio, iShares Gold Trust (IAU) at 0.25%, and SPDR Gold MiniShares (GLDM) at just 0.10%. All track the price of physical gold held in vaults. GLDM is the cheapest option for long-term investors. GLD offers the most liquidity for active traders.
Mining stocks. Companies like Newmont (NEM), Barrick Gold (GOLD), and Agnico Eagle Mines (AEM) offer leveraged exposure to gold prices. When gold rises 10%, mining stocks often rise 20-30% because their costs are relatively fixed while revenue grows with the gold price. The reverse is also true during downturns.
Gold IRAs. You can hold physical gold in a self-directed IRA, which shelters gains from the 28% collectibles tax. The gold must be stored in an IRS-approved depository and meet minimum fineness requirements (99.5% for bars, 91.67% for American Gold Eagles).
Gold Tax Rules: How the IRS Taxes Gold Sales
The IRS classifies physical gold and most gold funds as collectibles, taxed at a higher rate than stocks.
| Holding Period | Tax Rate |
|---|---|
| Less than 1 year (short term) | Ordinary income rate (10% to 37%) |
| More than 1 year (physical gold, GLD, IAU) | Up to 28% (collectibles rate) |
| More than 1 year (mining stocks) | 15% to 20% (standard capital gains) |
| Gold held in IRA or Roth IRA | Tax-deferred or tax-free (Roth) |
High earners may also owe an additional 3.8% Net Investment Income Tax, bringing the effective maximum federal rate on physical gold sales to 31.8%.
Tax planning tip. If you plan to hold gold for decades, a Roth IRA eliminates the collectibles tax entirely on withdrawal. For taxable accounts, GLDM's 0.10% expense ratio makes it the most cost-efficient vehicle. Mining stocks avoid the collectibles rate altogether but introduce company-specific risk.
2026 American Gold Eagle and U.S. Mint Coin Prices
The U.S. Mint has increased prices across its gold product line in 2026 to reflect the higher spot price.
| Product | Gold Content | 2026 Approximate Retail Price |
|---|---|---|
| 1 oz American Gold Eagle (BU) | 1.0000 oz fine gold | $5,200 - $5,400 |
| 1/2 oz American Gold Eagle | 0.5000 oz fine gold | $2,700 - $2,900 |
| 1/4 oz American Gold Eagle | 0.2500 oz fine gold | $1,450 - $1,550 |
| 1/10 oz American Gold Eagle | 0.1000 oz fine gold | $620 - $680 |
| 1 oz American Gold Buffalo | 1.0000 oz .9999 fine gold | $5,300 - $5,500 |
| 1 oz Proof Gold Eagle | 1.0000 oz fine gold | $5,800 - $6,200 |
American Gold Eagles are 22-karat (91.67% gold, alloyed with silver and copper for durability) and contain exactly 1 troy ounce of pure gold regardless of their total weight. American Gold Buffaloes are 24-karat (99.99% pure gold), which some investors prefer for purity but are softer and more susceptible to scratching.
For investors on a budget, fractional gold coins (1/10 oz and 1/4 oz Eagles) provide gold exposure at a lower entry point, though premiums per ounce are higher on smaller denominations.
Gold vs Silver in 2026: Which Precious Metal Should You Buy?
Both gold and silver are at historically elevated prices, but they serve different investment roles.
| Factor | Gold | Silver |
|---|---|---|
| Primary driver | Central bank buying, safe haven | Industrial demand (solar, EVs, AI) |
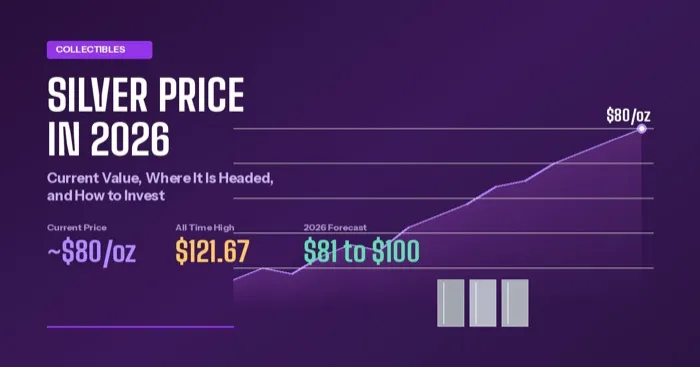
| 2026 consensus forecast | $5,000 - $6,300/oz | $55 - $100/oz |
| Volatility | Lower (10-15% annual swings typical) | Higher (30-50% swings common) |
| Storage practicality | $50,000 fits in your palm | $50,000 weighs 40+ lbs |
| Supply dynamic | Stable mine production ~3,670 tonnes/yr | 6-year structural deficit, 71% byproduct |
| Central bank buying | 863 tonnes in 2025 (massive) | No central bank purchases |
| Tax treatment | 28% collectibles rate | 28% collectibles rate |
The short version: Gold is the safer, more established store of value with central bank backing. Silver has more explosive upside potential due to the supply deficit and industrial demand growth, but comes with higher volatility. Many investors hold both, typically in a 70/30 or 60/40 gold-to-silver ratio by dollar value.
What Gold Investors and Collectors Should Do Now
If you already own gold, the rally from $2,050 to $5,000+ represents extraordinary gains. The structural drivers—central bank buying, dollar diversification, geopolitical risk—remain intact. Selling into strength is reasonable for rebalancing, but the long-term case has not deteriorated.
If you are looking to buy, gold at $5,000+ is expensive in absolute terms but may still be early in a multi-year revaluation. Dollar-cost averaging (buying a fixed dollar amount at regular intervals) reduces the risk of buying at a local peak. Consider starting with GLDM for low-cost exposure, then diversifying into physical coins if you want tangible assets.
If you are a coin collector, premiums on American Gold Eagles and Buffaloes have risen with spot prices but remain reasonable (3-8% above spot for bullion coins). Proof and limited-edition coins carry higher premiums but offer numismatic value beyond the metal content.
Keep records. Whatever form of gold you buy, document the purchase date, price, and quantity. You will need this information to calculate your tax basis when you eventually sell.
Gold's 2026 story is straightforward: the world's central banks are systematically buying physical gold at a pace not seen since the end of the gold standard. When the largest, most sophisticated institutional buyers on the planet are all moving in the same direction, paying attention is not optional.
For silver-specific analysis, see our live silver price guide, where silver is headed in 2026, and how high silver could go.
Sources
Written by
Sarah Kim
Collectibles market analyst covering precious metals, coins, and alternative investments.